What is all about?
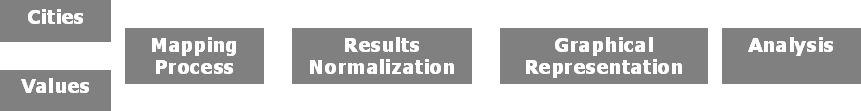
 Mapping City Values combines names of cities with a set of values in an automated application which searches in Google the number of hits per combination added. Results are normalized and displayed graphically. As result, individual patterns of values can be visualized.
Google is chosen as source of data due to its capability to map the internet in search for terms. Wikipedia definitions of “value” & “city” are used in the elaboration of criteria used.
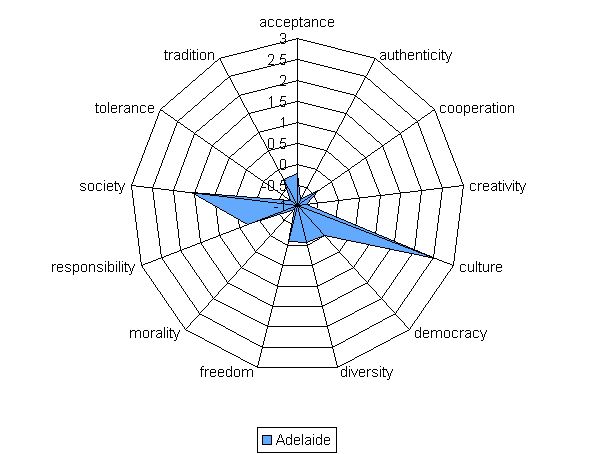
The tool tells you how many times two terms (city + value) are found together in Google. The information expresses the use of values in the context of a specific city, which is taken as unit indicating relevance. It makes you look at cities from a new perspective: how often e-citizens express themselves regarding a specific context, the city and its values? The intangible becomes tangible by measuring the core underlying values that contribute to the city’s system of beliefs, ideas and opinions. Arguably, some may say that a city ranking high in a certain value doesn’t make it a real condition in its daily life. The method should serve as indication of priorities in the agenda of e-citizens.
Cities
A 2006 ranking of 50 best cities by quality of life is used as criteria. The analysis is part of Mercer Consulting's annual 'World-wide Quality of Living Survey', covering more than 350 cities. Each city is based on an evaluation of 39 criteria, including political, social, economic and environmental factors, personal safety and health, education, transport, and other public services. Cities are ranked against New York as the base city, which has an index score of 100.
Values
A selection of values is done from the Wikipedia definition of “value”. To ensure consistency of the method, terminology is used following a taxonomical criterion. The use of nouns, verbs and adjectives may provide basis for further interpretation of data concerning how a specific term=value is used (description, action, operationalization, etc.)
posted by Oriol P. at 1:49 PM
![]()
![]()